Introduction
With the ubiquitous digitization of services, consumers can almost get everything done with the help of a mobile App. Analytics on App usage give valuable insights to product owners to improve and provide the best end-user experience. Analytics has always been a broad and complex subject area. The challenge has always been linking data and analytics to intended business value. Achieving the above goal is possible these days with the advent of cloud and cloud-based services. Data Pipelines, Data warehouses, and Business intelligence tools are the three major components of any analytics solution. These components are now available as a service (PaaS) with economies of scale, pay per use, and per-user license models baked into them. When cloud services are part of the overall analytical solution, they can help drive business value out of data quickly and cost-effectively.
Firebase and App analytics
Firebase is a Google cloud-based platform that helps fast track App development by simplifying the development efforts for building backend services. Google Analytics for Firebase provides insights into who the App users are and how they are using the Apps. From an analytical perspective, Google Analytics for Firebase fits the purpose well.
However, a single cloud strategy rarely exists for large enterprises, which typically implement a multi-cloud strategy. In simplistic terms, some cloud services are better than others for specific tasks. Different services from different cloud vendors are required to perform a multitude of specific tasks in any large enterprise.
App analytics outside Google Analytics
A typical scenario is when you have your ERP, Sales and Logistics data assets in the Azure data platform and your App usage data is in GCP. In the above case, you would do management reporting using Azure service as most of your enterprise data assets reside in Azure. To conform to enterprise standards, you are then required to integrate App usage data to Azure
The following are the reasons why Firebase App analytics happen outside Google Analytics.
- Enterprise Standard for reporting is not Google Analytics.
- Multi-Cloud Strategy.
- Unsampled reporting and analysis requirements.
Firebase dataset in BigQuery
Linking your Firebase project to BigQuery lets you access your raw, unsampled event data along with all your parameters and user properties. Firebase exports both App Usage and Crash data to BigQuery. Thus, you can use BigQuery to generate customized App usage metrics.
Understanding what data is available and how BigQuery organizes this data is essential for building analytics.
Look at the sample below:
- Firebase captures preconfigured and custom events (events) from the apps.
- All event timestamps are in UTC.
- Data is not organized in simple rows and columns. Instead, usage data in BigQuery looks more like JSON objects where each column can contain single data or structs or an array of structs.
Identify App metrics that can drive business value from available data and acknowledge the need for data summarization before moving data to other cloud platforms (e.g., Azure). Below are some KPIs you could be looking at to understand how well your Apps are performing.
Let us now look at few KPIs and how to go about them in BigQuery.
1. Active User
Google defines an active user as – The user who has engaged with an app in the device foreground and has logged a user engagement event. Firebase maintains a unique user_pseudo_id for every user and logs a user_engagement event when the user keeps the App open in the foreground and meets the required goal to trigger the engagement event. This blog post uses public sample export data Firebase Public Dataset from a mobile game App "Flood It". Of course, you can use your data from your Apps.
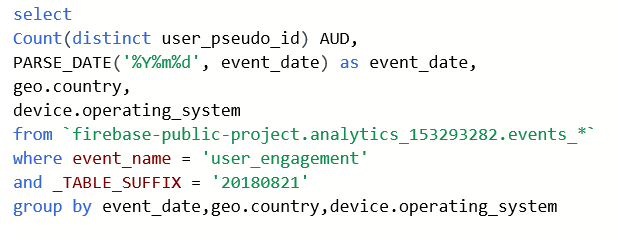
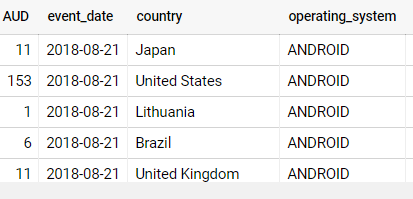
The AUD or Active users daily can be summarized for a given day , OS Version and country like below. As mentioned before, Firebase exports a new table to an associated BigQuery dataset every day. Looking for a specific event date does not restrict BigQuery from scanning all the wild card tables or associated data.
Tip! Always limit your query only to the intended tables, use the _Table_suffix pseudo column in the where clause. Using _Table_suffix will significantly reduce the number of bytes scanned.
Result
Note! Before firing any query look at the approximate bytes BigQuery will process for your query. Pay attention to the top right corner. You will see something like the picture shown below. You can use this data to understand the cost of your query.
Filter conditions used for _TABLE_SUFFIX that are not constant expressions do not limit the number of tables scanned. Please ensure filter conditions evaluate to a constant expression to limit the tables scanned by BigQuery. In the above e.g. we have hard coded the _TABLE_SUFFIX but you can use CURRENT_DATE() function and additional logic to pass the value dynamically for every run.
The first day and the last day of the current month can be derived as shown above and can be used to summarize data for a given month.
2. User Opt-ins
Let us look at users who have used quick play.Firebase sets a user property to plays_quickplay and BigQuery stores user params as a repeated record.
Quick Tip: The UNNEST function in BigQuery will help you to break down the repeated record and extract the required value. You can use select from UNNEST, which essentially acts as a temporary table. You then filter the temp table and take the corresponding value.string_value. This way you can flatten the rows.
Results
With the ability to break BigQuery's repeated record to rows and extract the required column value and restrict BigQuery to process only intended data, you are ready for some advanced data preparation scenarios shown below.
3. Average session duration
Let us look at methods to compute the average session duration for your App. You want to understand the session duration across days. What is the average days in between App usage? This is particularly useful for food delivery or similar Apps that are not used every day.
Google's definition for sessions goes like this-
In Google Analytics 4, a session is initiated when an app is opened in the foreground or when a webpage is opened. There is no limit to how long a session can last. A session ends after 30 minutes of inactivity on the part of the user.
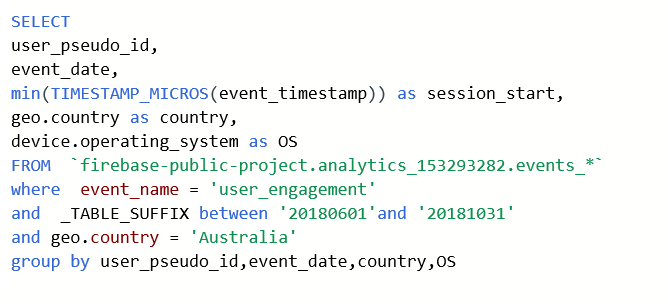
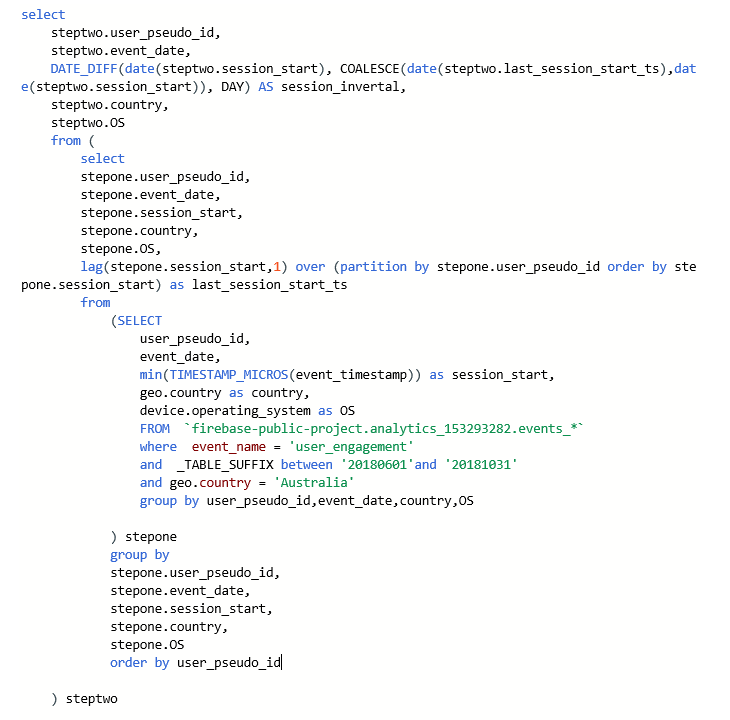
Step 1 is to find the minimum of event time for engagement event for every user. Although there can be many engagement events for a user in a day, we are interested in only the earliest engagement event.
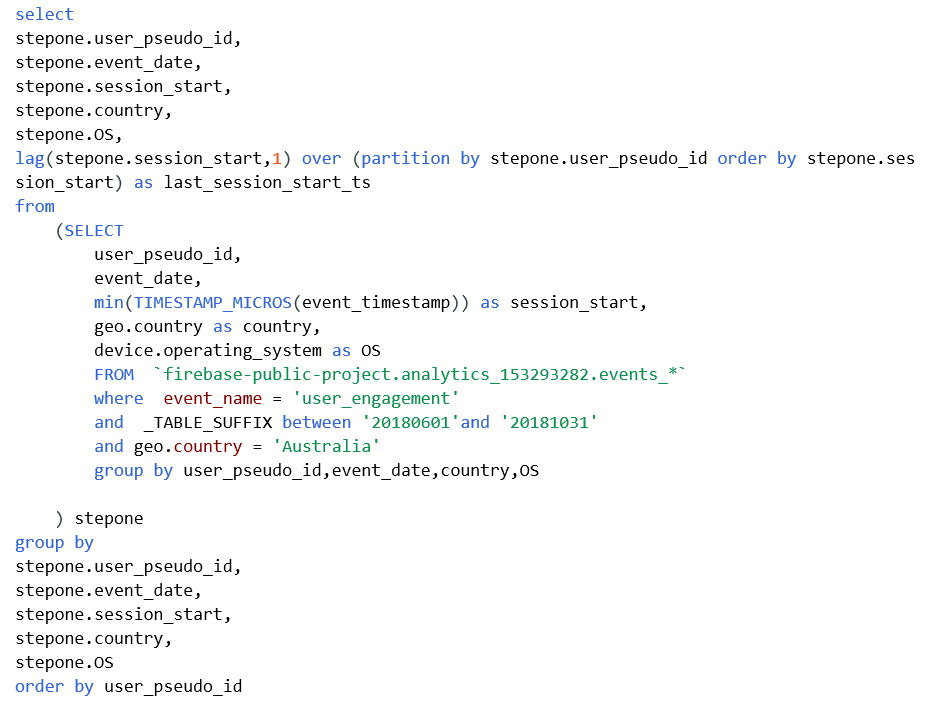
Step 2 is to identify the previous engagement session for every user
Result
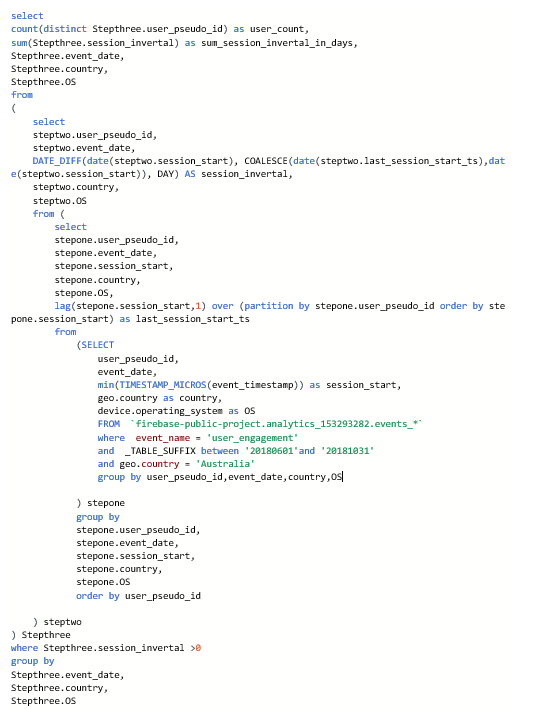
Step 3 is to find the session interval for every user for all days in the intended period.
Step 4 is to find the total unique users for a given day and Sum of session intervals from step 3. You filter for session interval>0 to remove the rows with no previous session.
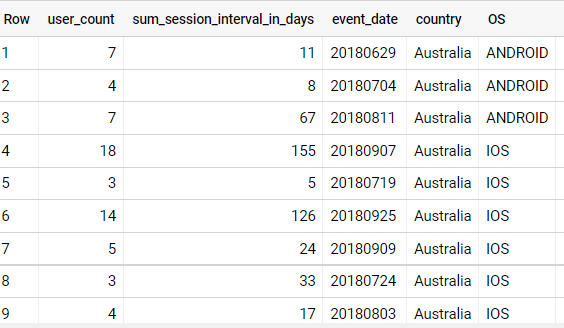
With the count of users and session interval (in days) you can derive the average session interval.
Result
4. Retention
Retention gives powerful insights to the business on how their App is performing. High retention is good in many ways. You need not spend acquiring new users; the existing users act as bandwagons for the App.
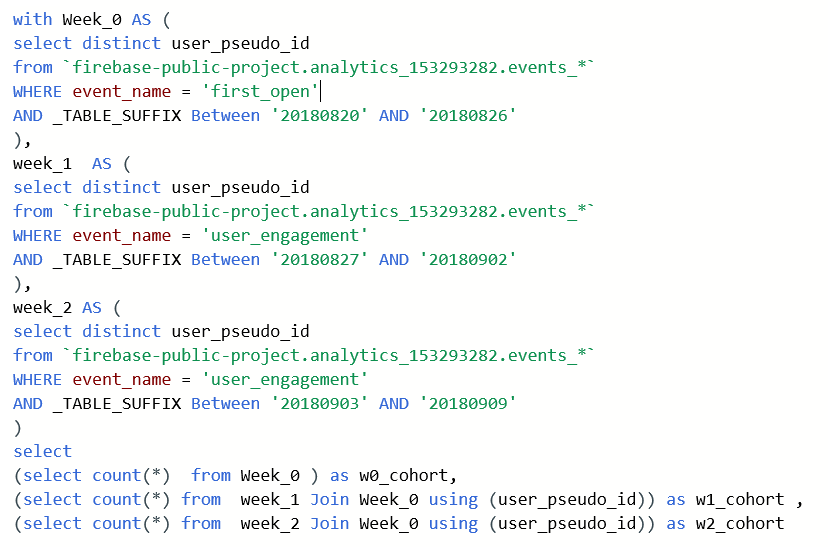
Let us take an e.g., where you want to compute retention for two weeks. Following are the steps to achieve this.
- Identify the New users by looking for first_open event for the intended Week
- Identify all users in the subsequent two weeks who registered an engagement event
- Then Identify the cohorts from Week 0 who engaged with the App in Week 1 and Week 2
Result
This means out of all the first time users from week 1, You retained only 19% in the second week and 10% in the week after. The above query is for computing retention for two weeks. However, you may have a requirement to compute for multiple weeks. In such cases, estimate the overall data processed and dynamically filter the tables only for the weeks you want to calculate retention and estimate the cost before implementation.
Note: Total amount of processed data with all the above queries will be about 2.5 GB
Import Data to Azure and Reporting
After preparing the summarized data, create Azure data factory (ADF V2) pipeline to copy data from Bigquery to Synapse. Load this data to the data model in Synapse. This data can now be consumed in Power BI and intended KPIs can be built using DAX and released to business users.
Using This blog post you
- Understood the basics for exploring firebase BigQuery dataset
- Scenarios when reporting is done outside of GA
- KPIs that can be built using firebase dataset in BigQuery
- Mechanics to prepare data and sample code for accomplishing the same.
- Few tips and notes when working with firebase BigQuery dataset
***


